Edit chart
Loading graph
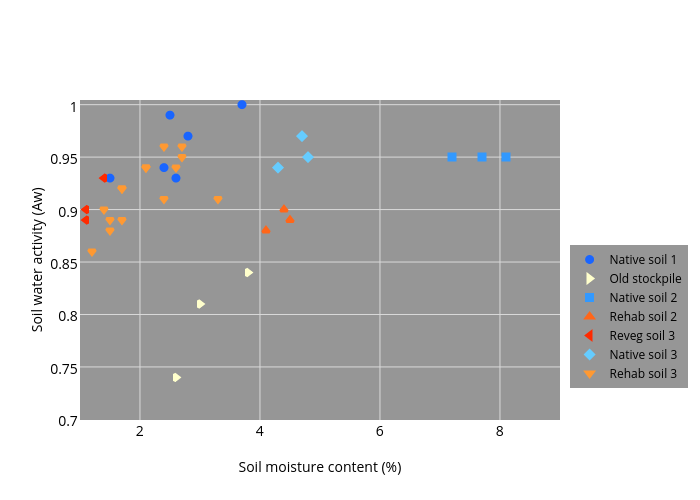
Howard.wildman's interactive graph and data of "Soil water activity (Aw) vs Soil moisture content (%)" is a scatter chart, showing Native soil 1, Old stockpile, Native soil 2, Rehab soil 2, Reveg soil 3, Native soil 3, Rehab soil 3; with Soil moisture content (%) in the x-axis and Soil water activity (Aw) in the y-axis.. The x-axis shows values from 1.0004554610867569 to 9.000455461086759. The y-axis shows values from 0.6994278255671296 to 1.0044278255671295.