Edit chart
Loading graph
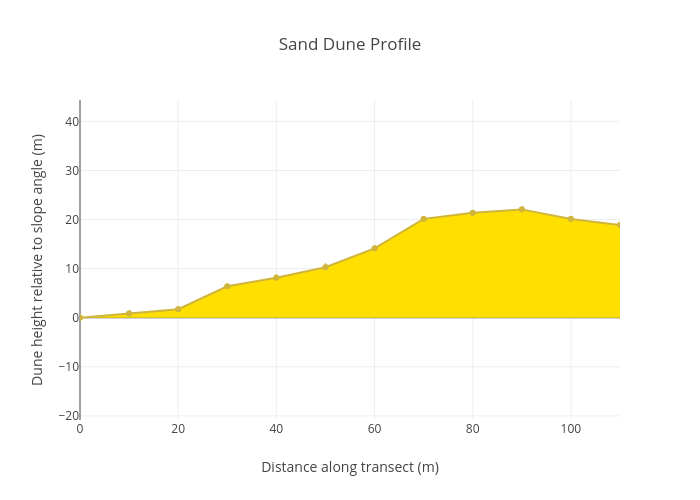
Hlm's interactive graph and data of "Sand Dune Profile" is a filled line chart, showing marker: star; with Distance along transect (m) in the x-axis and Dune height relative to slope angle (m) in the y-axis.. The x-axis shows values from 0 to 110. The y-axis shows values from -6.357603560698838 to 29.902107871043665.