Edit chart
Loading graph
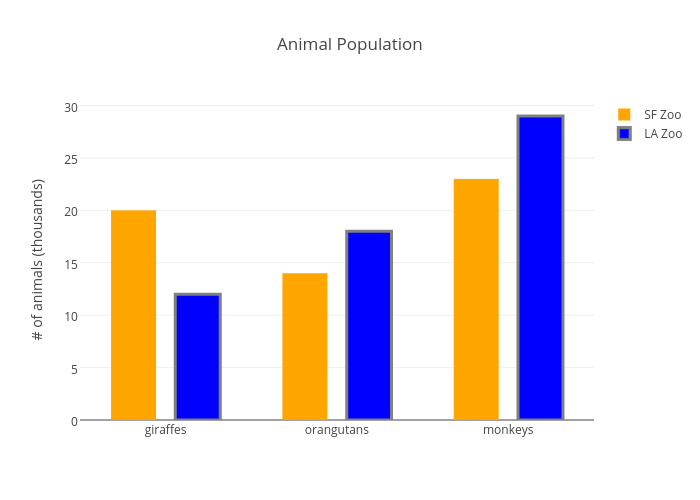
Hezeyang's interactive graph and data of "Animal Population" is a grouped bar chart, showing SF Zoo vs LA Zoo; with # of animals (thousands) in the y-axis. The x-axis shows values from 0 to 0. The y-axis shows values from 0 to 0.