Edit chart
Loading graph
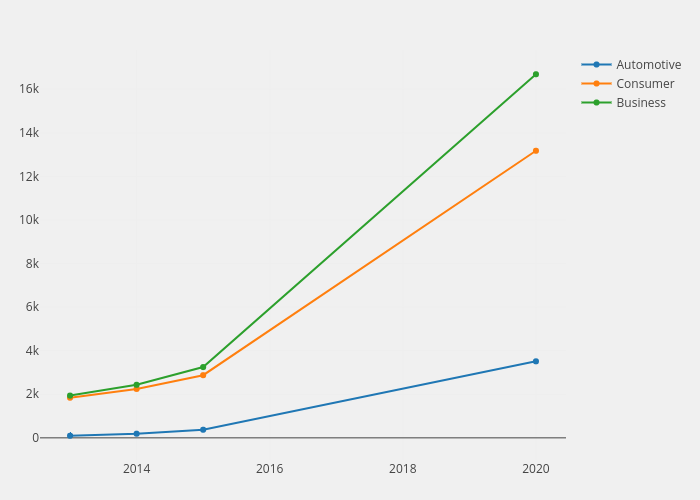
Henrylau's interactive graph and data of "Automotive, Consumer, Business" is a scatter chart, showing Automotive, Consumer, Business. The x-axis shows values from 2012.556705838463 to 2020.443294161537. The y-axis shows values from -959.867638483965 to 17739.467638483962.