Edit chart
Loading graph
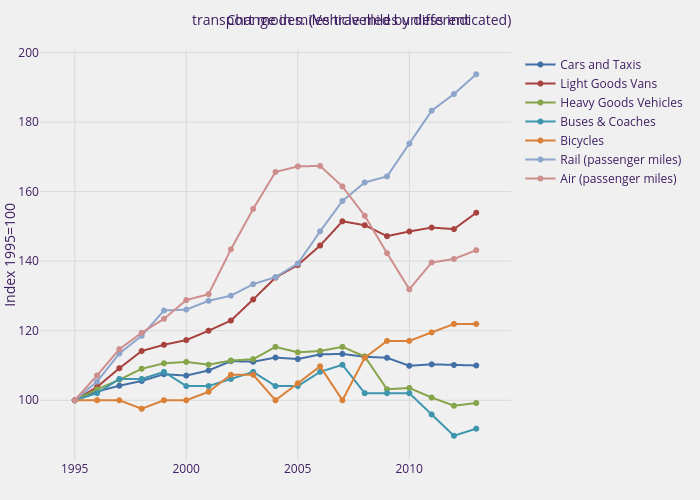
Henrylau's interactive graph and data of "Change in miles travelled by different transport modes. (Vehicle miles unless indicated)" is a scatter chart, showing Cars and Taxis, Light Goods Vans, Heavy Goods Vehicles, Buses & Coaches, Bicycles, Rail (passenger miles), Air (passenger miles); with Index 1995=100 in the y-axis. The x-axis shows values from 1993.5243106714377 to 2014.4756893285623. The y-axis shows values from 83.1790398445238 to 200.3634534254762.