Edit chart
Loading graph
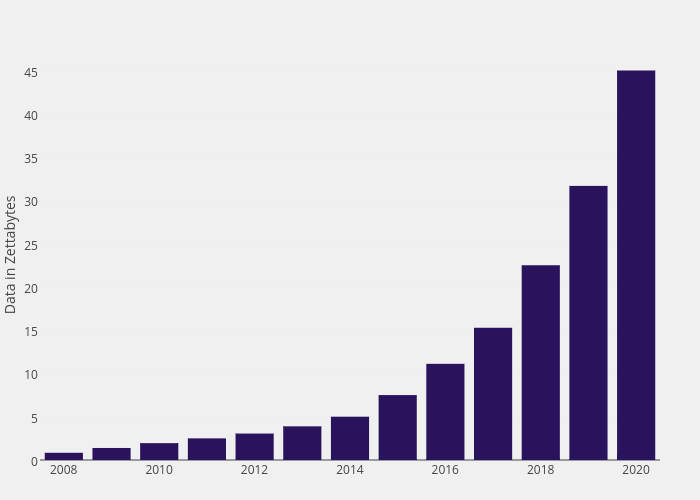
Henrylau's interactive graph and data of "Col2" is a bar chart, showing Col2; with Data in Zettabytes in the y-axis. The x-axis shows values from 2007.5 to 2020.5. The y-axis shows values from 0 to 47.368421052631575.