Edit chart
Loading graph
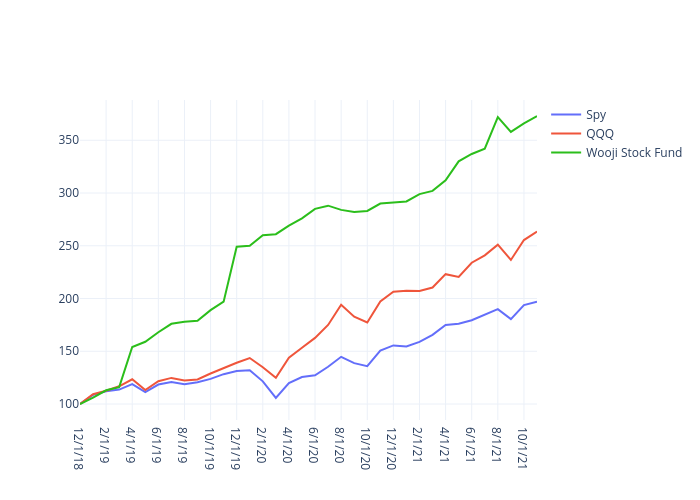
Hemant.h's interactive graph and data of "Spy, QQQ, Wooji Stock Fund" is a line chart, showing Spy, QQQ, Wooji Stock Fund. The x-axis shows values from 0 to 35. The y-axis shows values from 84.83333333333334 to 388.1666666666667.