Edit chart
Loading graph
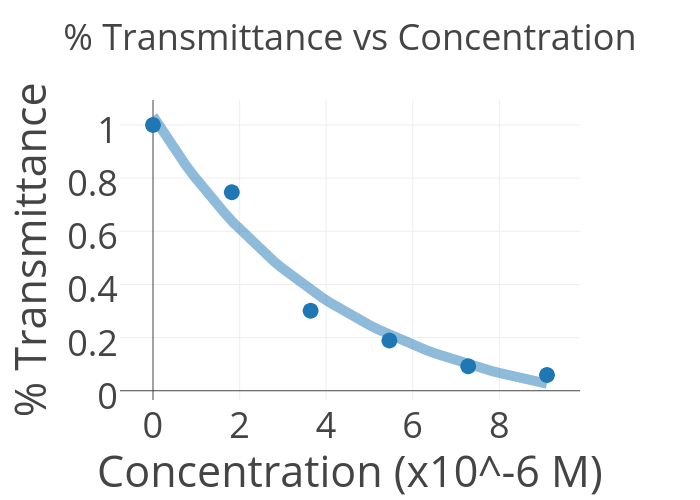
Harrisonw19's interactive graph and data of "% Transmittance vs Concentration" is a scatter chart, showing Col2 vs Col2 - fit; with Concentration (x10^-6 M) in the x-axis and % Transmittance in the y-axis.. The x-axis shows values from -0.6106715874831065 to 9.710671587483105. The y-axis shows values from -0.029469422432728175 to 1.089601779473039.