Edit chart
Loading graph
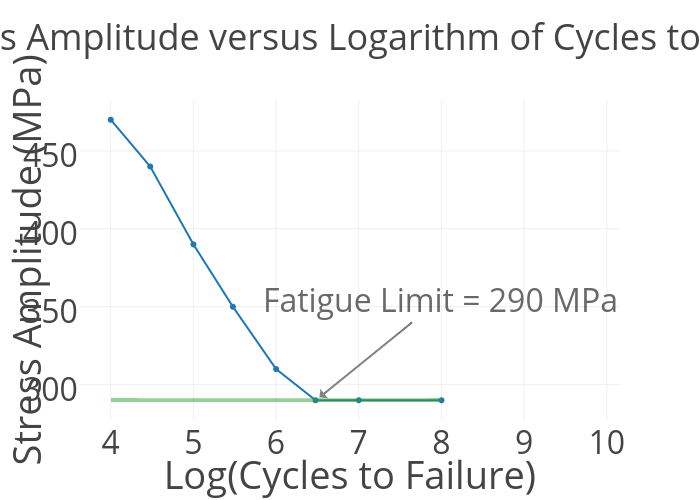
Harr1961's interactive graph and data of "8. Stress Amplitude versus Logarithm of Cycles to Failure" is a line chart, showing Stress Amplitude (MPa) vs Col4 - fit; with Log(Cycles to Failure) in the x-axis and Stress Amplitude (MPa) in the y-axis.. The x-axis shows values from 3.660132311592125 to 9.671967539515709. The y-axis shows values from 278.7231869254341 to 481.2768130745659. This visualization has the following annotation: Fatigue Limit = 290 MPa