Edit chart
Loading graph
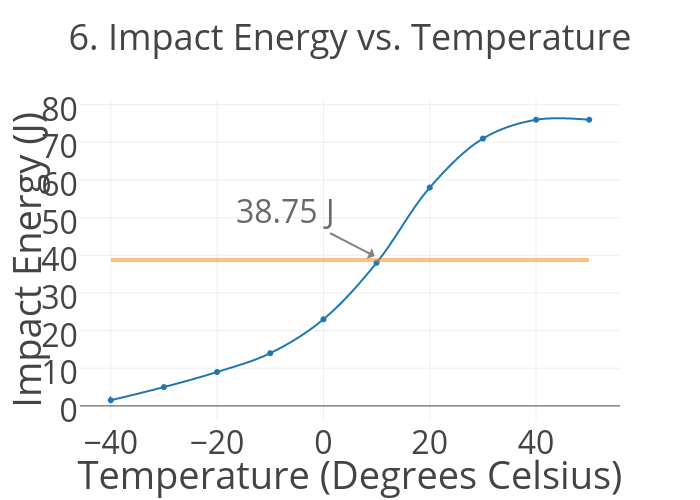
Harr1961's interactive graph and data of "6. Impact Energy vs. Temperature" is a line chart, showing Col2 vs Col4 - fit; with Temperature (Degrees Celsius) in the x-axis and Impact Energy (J) in the y-axis.. The x-axis shows values from -45.73659398939305 to 55.73659398939305. The y-axis shows values from -3.2036935953420675 to 80.70369359534207. This visualization has the following annotation: 38.75 J