Edit chart
Loading graph
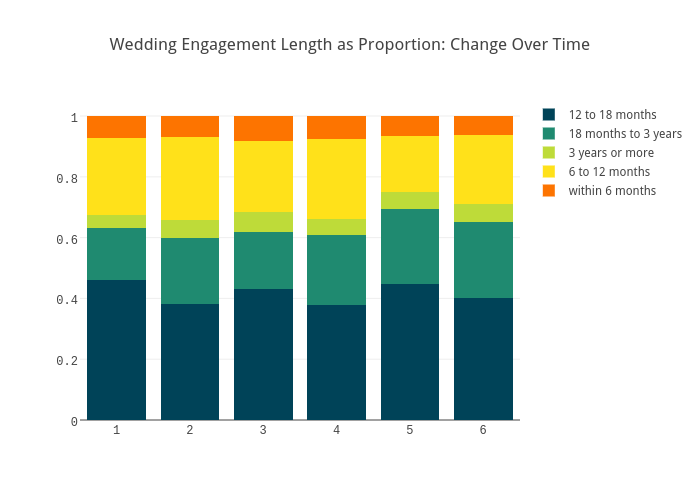
Harlenokeeffe's interactive graph and data of "Wedding Engagement Length as Proportion: Change Over Time" is a stacked bar chart, showing 12 to 18 months, 18 months to 3 years, 3 years or more, 6 to 12 months, within 6 months. The x-axis shows values from 0.5 to 6.5. The y-axis shows values from 0 to 1.0526315789473684.