Edit chart
Loading graph
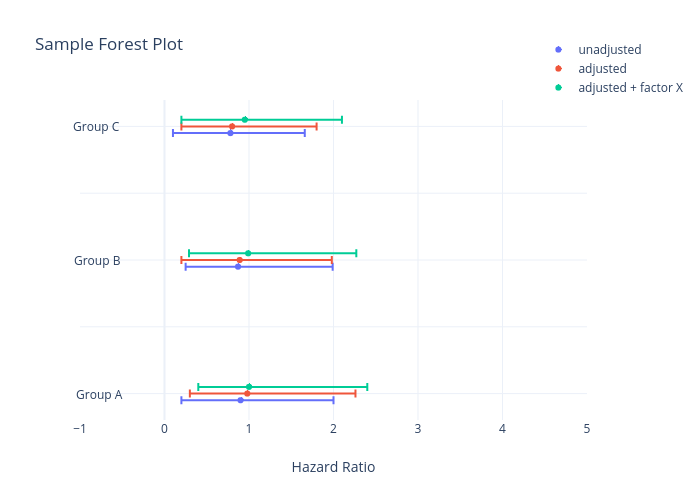
Gzork's interactive graph and data of "Sample Forest Plot" is a scatter chart, showing unadjusted, adjusted, adjusted + factor X; with Hazard Ratio in the x-axis. The x-axis shows values from -1 to 5. The y-axis shows values from 79.7677261613692 to 320.2322738386308. This visualization has the following annotations: Group A; Group B; Group C