Edit chart
Loading graph
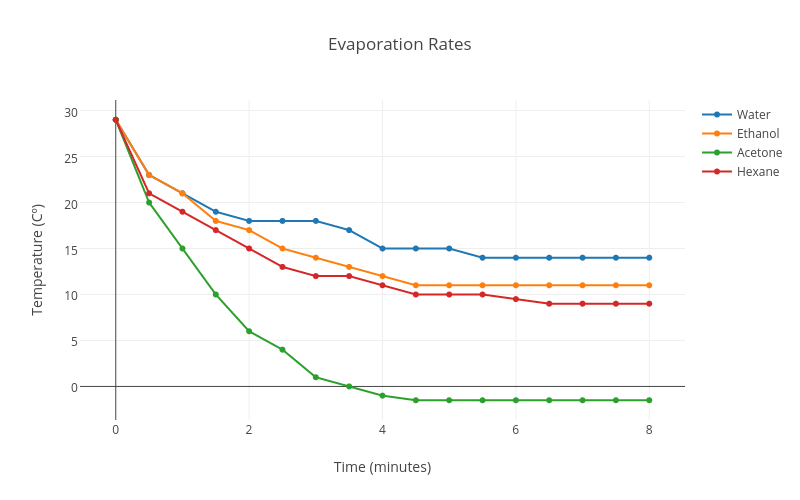
Guimonda1's interactive graph and data of "Evaporation Rates" is a scatter chart, showing Water, Ethanol, Acetone, Hexane; with Time (minutes) in the x-axis and Temperature (Cº) in the y-axis.. The x-axis shows values from -0.5065176908752328 to 8.506517690875233. The y-axis shows values from -3.6475044563279857 to 31.147504456327987.