Edit chart
Loading graph
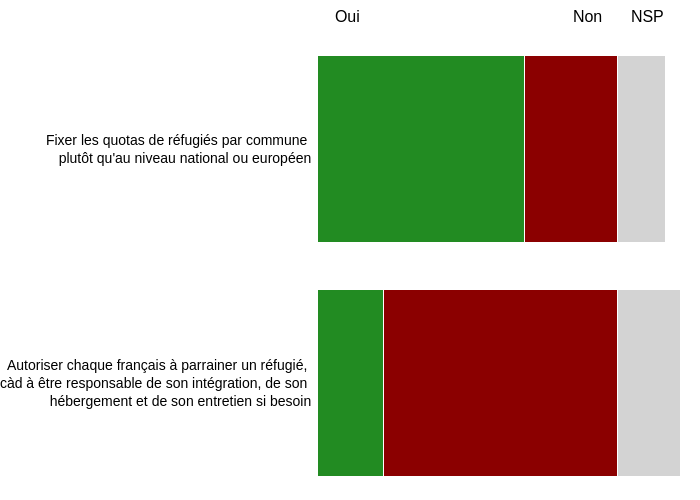
Gmx's interactive graph and data is a stacked bar chart. The x-axis shows values from 0 to 0. The y-axis shows values from 0 to 0. This visualization has the following annotations: Autoriser chaque français à parrainer un réfugié, càd à être responsable de son intégration, de son hébergement et de son entretien si besoin; Fixer les quotas de réfugiés par commune plutôt qu'au niveau national ou européen; Oui; Non; NSP