Edit chart
Loading graph
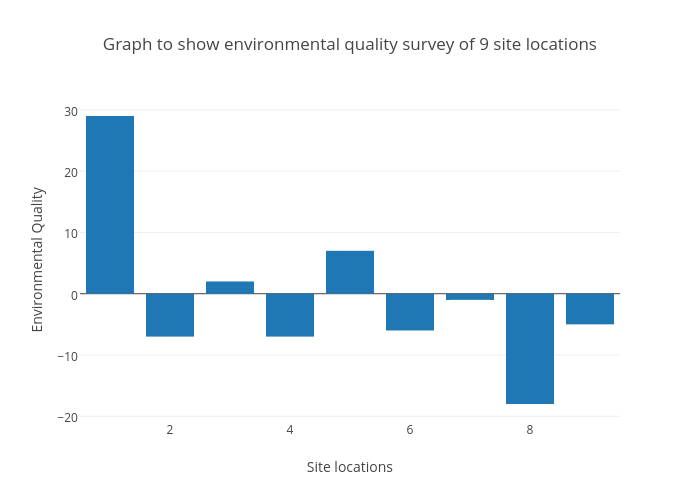
Ghadabi's interactive graph and data of "Graph to show environmental quality survey of 9 site locations" is a bar chart, showing B; with Site locations in the x-axis and Environmental Quality in the y-axis.. The x-axis shows values from 0.5 to 9.5. The y-axis shows values from -20.61111111111111 to 31.61111111111111.