Edit chart
Loading graph
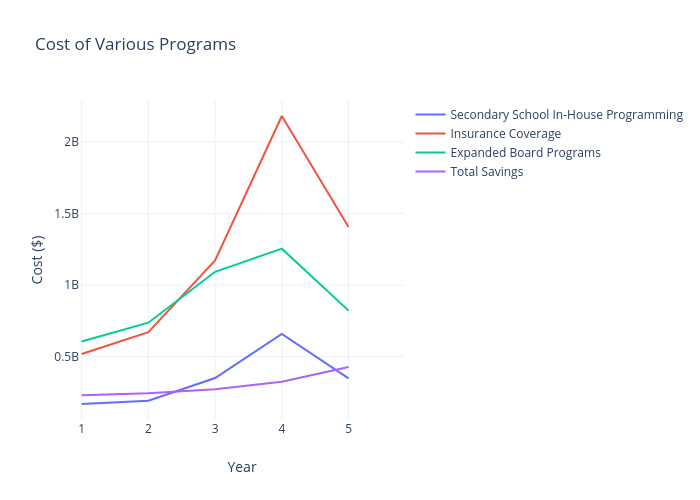
Fierfaiz's interactive graph and data of "Cost of Various Programs" is a line chart, showing Secondary School In-House Programming, Insurance Coverage, Expanded Board Programs, Total Savings; with Year in the x-axis and Cost ($) in the y-axis.. The x-axis shows values from 0.9753349440080951 to 5.8308496008006. The y-axis shows values from 57523778.742222205 to 2293543232.897778.