Edit chart
Loading graph
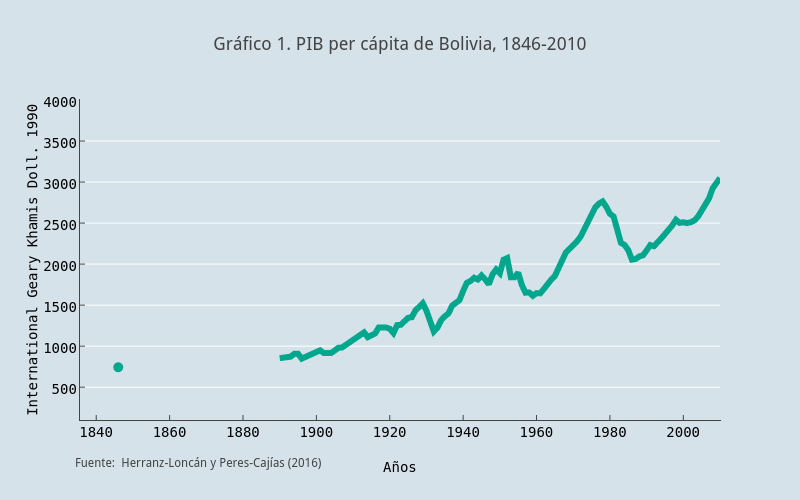
Faro's interactive graph and data of "Gráfico 1. PIB per cápita de Bolivia, 1846-2010" is a scatter chart, showing Bolivia: PIB per capita vs Bolivia: PIB per; with Años in the x-axis and International Geary Khamis Doll. 1990 in the y-axis.. The x-axis shows values from 1835.57540506855 to 2010. The y-axis shows values from 100 to 4000. This visualization has the following annotation: Fuente: Herranz-Loncán y Peres-Cajías (2016)