Edit chart
Loading graph
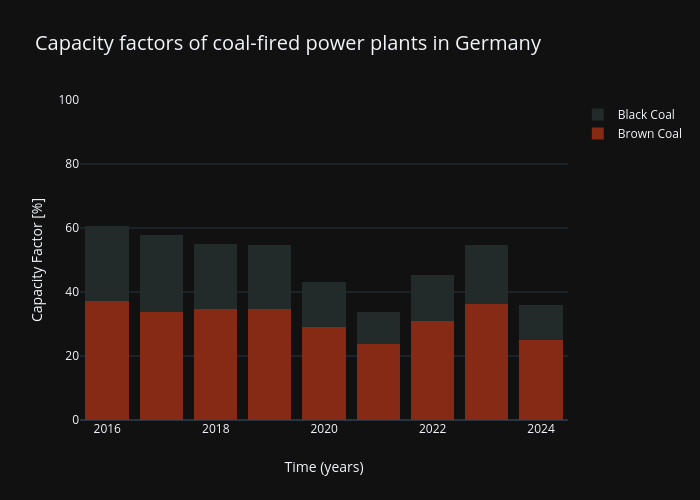
Falco179's interactive graph and data of "Capacity factors of coal-fired power plants in Germany" is a stacked bar chart, showing Brown Coal vs Black Coal; with Time (years) in the x-axis and Capacity Factor [%] in the y-axis.. The x-axis shows values from 2015-07-01 12:00 to 2024-06-30 12:00. The y-axis shows values from 0 to 100.