Edit chart
Loading graph
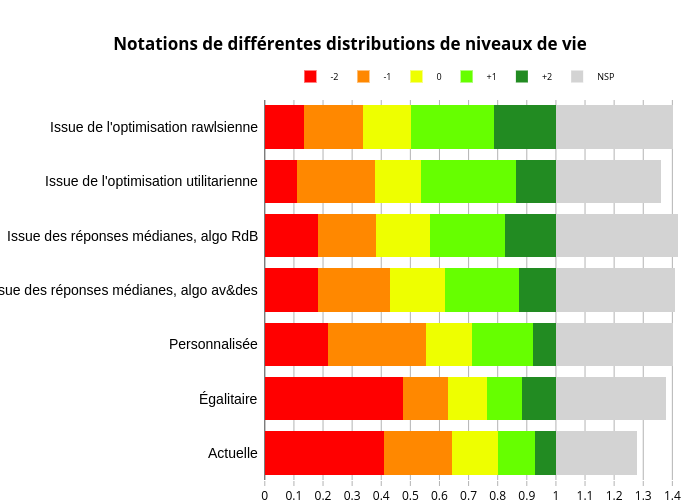
Fabre.adri1's interactive graph and data of "Notations de différentes distributions de niveaux de vie" is a stacked bar chart, showing -2, -1, 0, +1, +2, NSP. The x-axis shows values from 0 to 0. The y-axis shows values from 0 to 0. This visualization has the following annotations: Actuelle; Égalitaire; Personnalisée; Issue des réponses médianes, algo av&des; Issue des réponses médianes, algo RdB; Issue de l'optimisation utilitarienne; Issue de l'optimisation rawlsienne