Edit chart
Loading graph
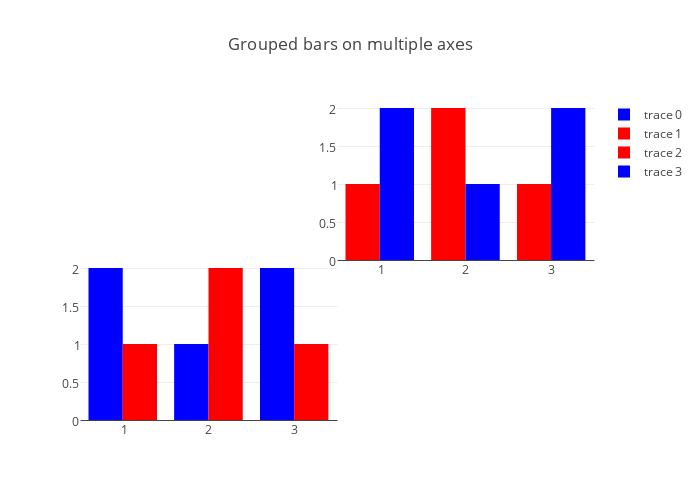
Etpinard's interactive graph and data of "Grouped bars on multiple axes" is a grouped bar chart. The x-axis shows values from 0.5 to 3.5. The y-axis shows values from 0 to 2.1052631578947367.