Edit chart
Loading graph
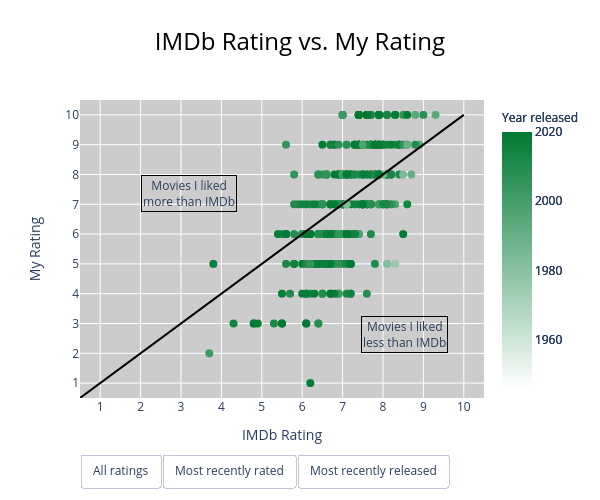
Ethanfuerst's interactive graph and data of "IMDb Rating vs. My Rating" is a scatter chart; with IMDb Rating in the x-axis and My Rating in the y-axis.. The x-axis shows values from 0.5 to 10.5. The y-axis shows values from 0.5 to 10.5. This visualization has the following annotations: Movies I likedmore than IMDb; Movies I likedless than IMDb