Edit chart
Loading graph
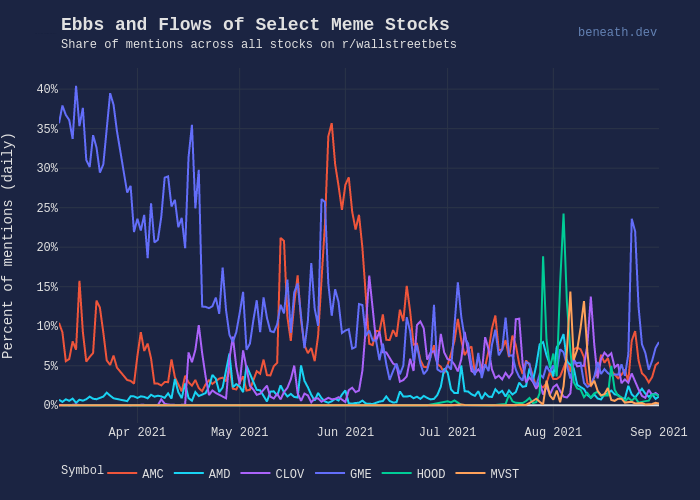
Ericpgreen's interactive graph and data of "Ebbs and Flows of Select Meme Stocks" is a line chart, showing AMC, AMD, CLOV, GME, HOOD, MVST; with Percent of mentions (daily) in the y-axis. The x-axis shows values from 0 to 0. The y-axis shows values from 0 to 0. This visualization has the following annotations: beneath.dev; Share of mentions across all stocks on r/wallstreetbets; Ebbs and Flows of Select Meme Stocks