Edit chart
Loading graph
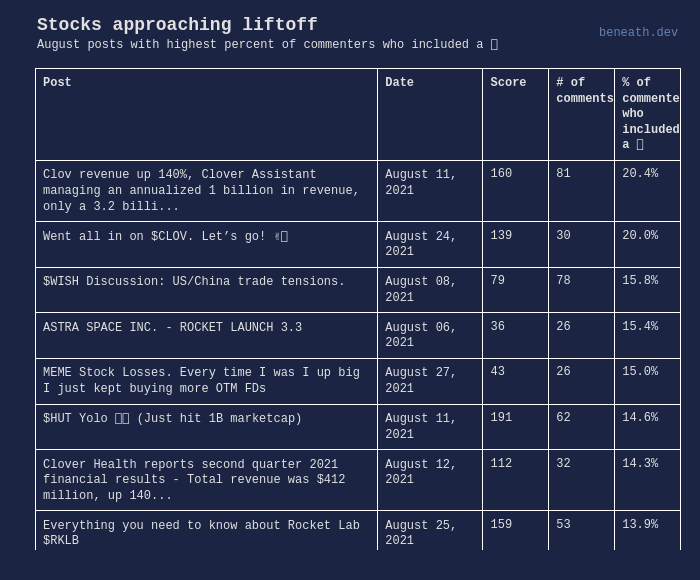
Ericpgreen's interactive graph and data of "Stocks approaching liftoff" is a table. The x-axis shows values from 0 to 0. The y-axis shows values from 0 to 0. This visualization has the following annotations: beneath.dev; August posts with highest percent of commenters who included a 🚀; Stocks approaching liftoff