Edit chart
Loading graph
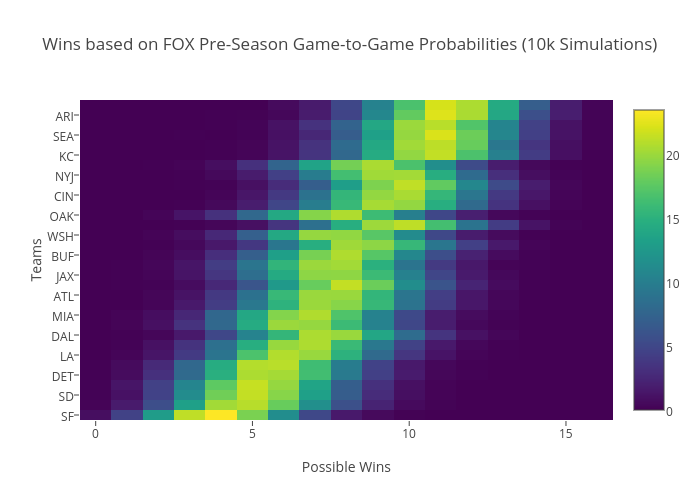
Ep8's interactive graph and data of "Wins based on FOX Pre-Season Game-to-Game Probabilities (10k Simulations)" is a heatmap; with Possible Wins in the x-axis and Teams in the y-axis.. The x-axis shows values from -0.5 to 16.5. The y-axis shows values from -0.5 to 31.5.