Edit chart
Loading graph
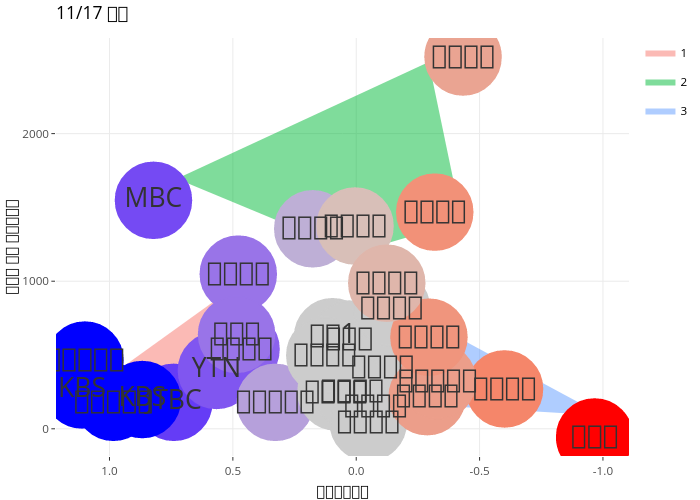
Enteronce's interactive graph and data of "11/17 기준" is a filled line chart, showing 1, 2, 3; with 댓글여론비율 in the x-axis and 하루당 평균 댓글합계수 in the y-axis.. The x-axis shows values from -1.216814922333 to 1.10556261534919. The y-axis shows values from -184.33071169327 to 2647.92475785851.