Edit chart
Loading graph
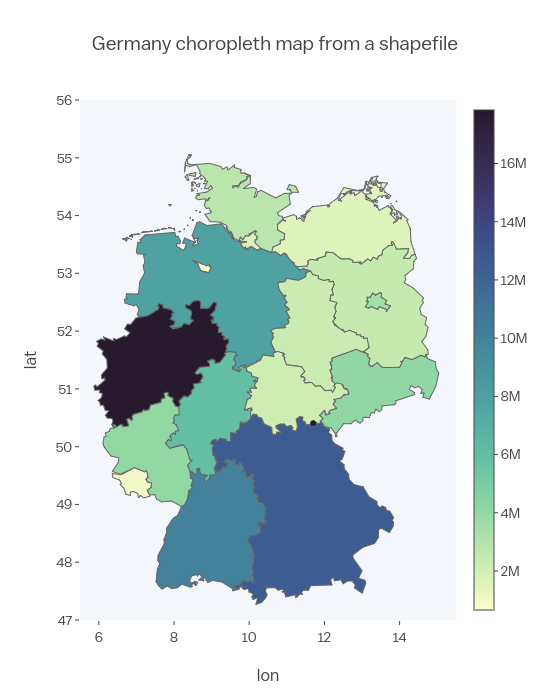
Empet's interactive graph and data of "Germany choropleth map from a shapefile" is a filled line chart; with lon in the x-axis and lat in the y-axis.. The x-axis shows values from 5.5 to 15.5. The y-axis shows values from 47 to 56.