Edit chart
Loading graph
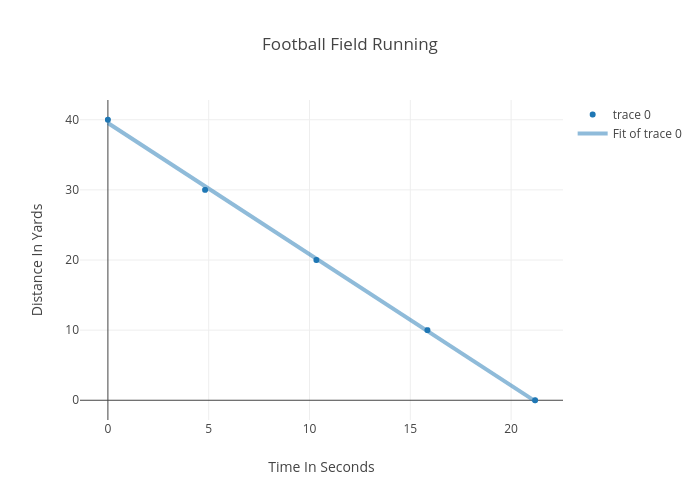
Emilygilmartin's interactive graph and data of "Football Field Running " is a scatter chart; with Time In Seconds in the x-axis and Distance In Yards in the y-axis.. The x-axis shows values from -1.3365646995127238 to 22.526564699512726. The y-axis shows values from -3.1314784506273865 to 43.131478450627384.