Edit chart
Loading graph
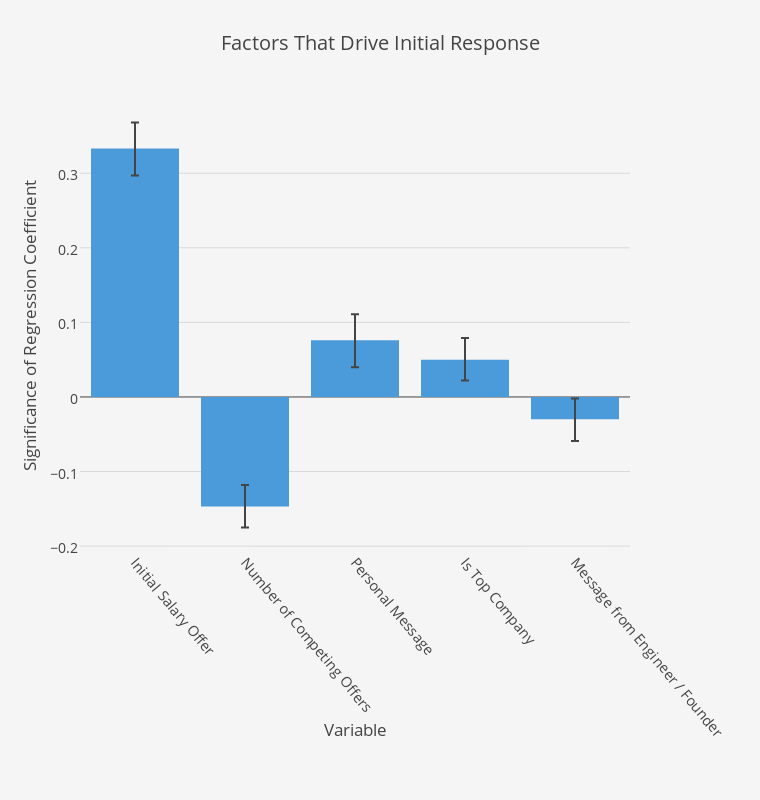
Elliotk's interactive graph and data of "Factors That Drive Initial Response" is a bar chart, showing Coefficient; with Variable in the x-axis and Significance of Regression Coefficient in the y-axis.. The x-axis shows values from -0.5 to 4.5. The y-axis shows values from -0.20516666666666666 to 0.39816666666666667.