Edit chart
Loading graph
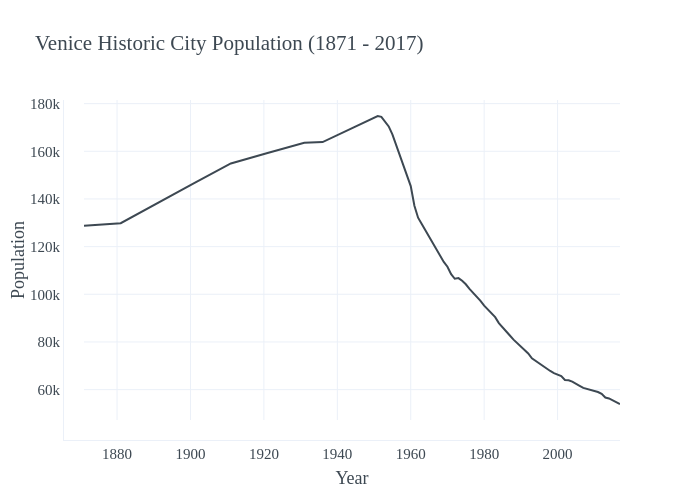
Elevenso's interactive graph and data of "Venice Historic City Population (1871 - 2017)" is a line chart; with Year in the x-axis and Population in the y-axis.. The x-axis shows values from 1871 to 2017. The y-axis shows values from 47263.11111111111 to 181520.88888888888.