Edit chart
Loading graph
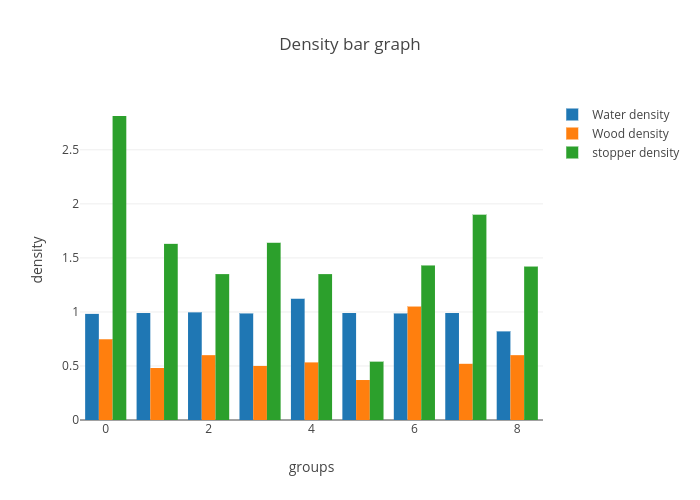
Eg112003's interactive graph and data of "Density bar graph" is a bar chart, showing Water density , Wood density, stopper density ; with groups in the x-axis and density in the y-axis.. The x-axis shows values from -0.5 to 8.5. The y-axis shows values from 0 to 2.9610526315789474.