Edit chart
Loading graph
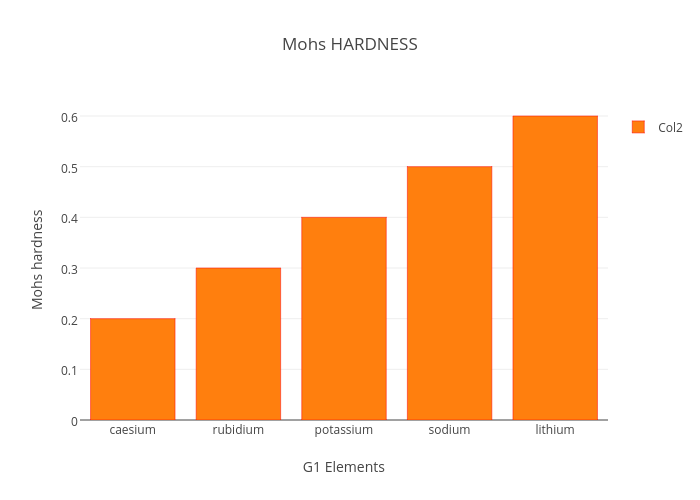
Eaboukar13's interactive graph and data of "Mohs HARDNESS" is a bar chart, showing Col2; with G1 Elements in the x-axis and Mohs hardness in the y-axis.. The x-axis shows values from -0.5 to 4.5. The y-axis shows values from 0 to 0.631578947368421.