Edit chart
Loading graph
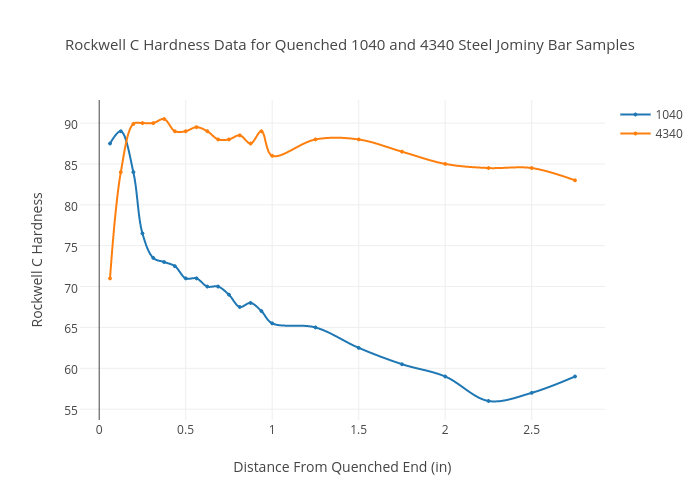
Drew.thompson's interactive graph and data of "Rockwell C Hardness Data for Quenched 1040 and 4340 Steel Jominy Bar Samples" is a line chart, showing 1040 vs 4340; with Distance From Quenched End (in) in the x-axis and Rockwell C Hardness in the y-axis.. The x-axis shows values from -0.10658112582781457 to 2.9190811258278146. The y-axis shows values from 53.40845070422535 to 93.09154929577466.