Edit chart
Loading graph
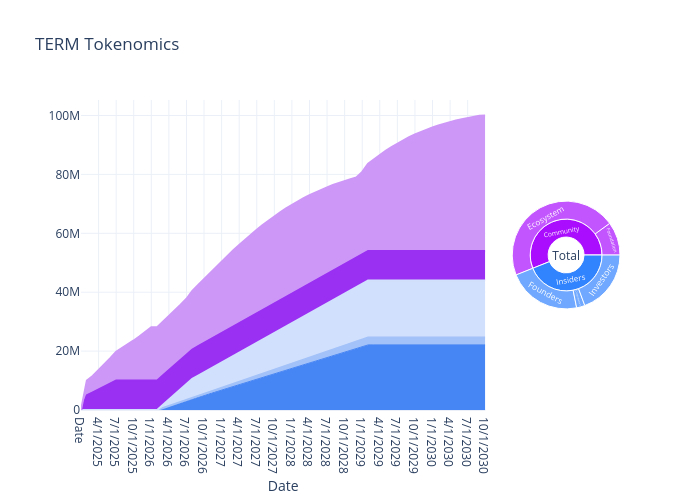
Dionchu's interactive graph and data of "TERM Tokenomics" is a sunburst, showing Distribution, Founders, Core Contributors, Investors, Foundation, Ecosystem; with Date in the x-axis and in the y-axis.. The x-axis shows values from 0 to 69. The y-axis shows values from 0 to 105263157.89473684.