Edit chart
Loading graph
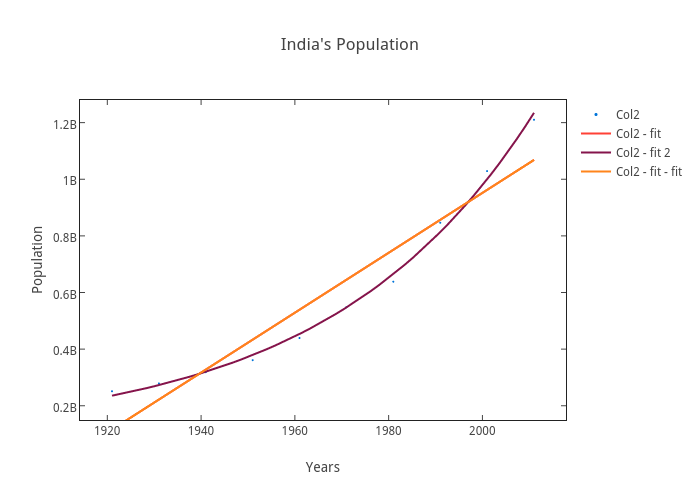
Dhershey's interactive graph and data of "India's Population" is a scatter chart, showing Col2, Col2 - fit, Col2 - fit 2, Col2 - fit - fit; with Years in the x-axis and Population in the y-axis.. The x-axis shows values from 1915.252168710739 to 2016.747831289261. The y-axis shows values from 149655252.97740972 to 1279931565.2112055.