Edit chart
Loading graph
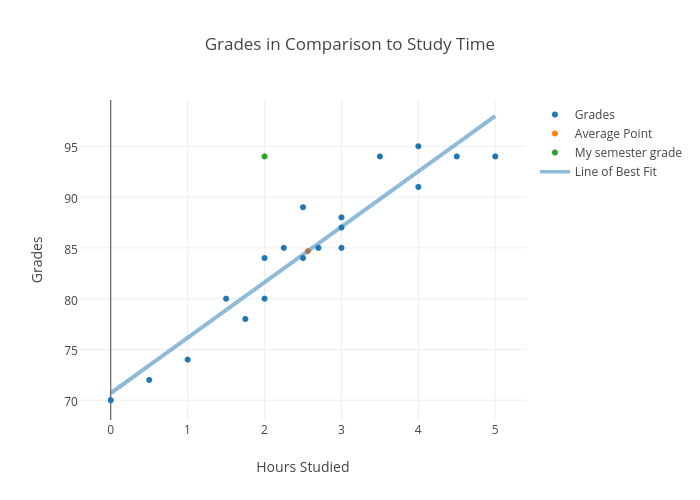
Despey's interactive graph and data of "Grades in Comparison to Study Time" is a scatter chart, showing Grades, Average Point, My semester grade, Line of Best Fit; with Hours Studied in the x-axis and Grades in the y-axis.. The x-axis shows values from -0.32271654870239297 to 5.322716548702393. The y-axis shows values from 68.05342848047111 to 99.55519658277073.