Edit chart
Loading graph
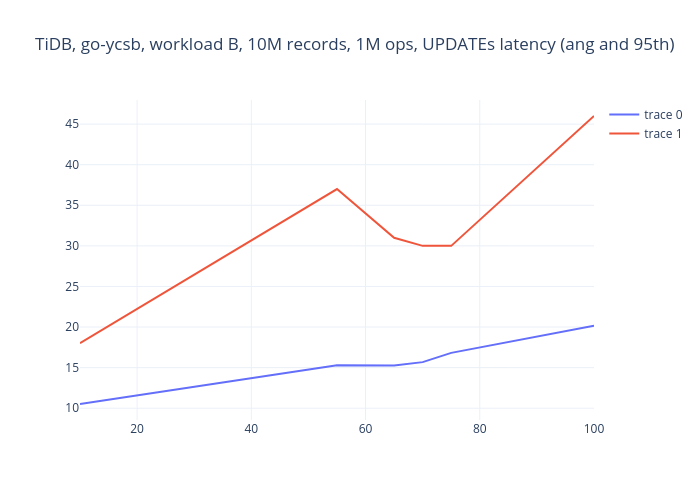
Deniszh's interactive graph and data of "TiDB, go-ycsb, workload B, 10M records, 1M ops, UPDATEs latency (ang and 95th)" is a line chart. The x-axis shows values from 10 to 100. The y-axis shows values from 8.545722222222222 to 47.97127777777778.