Edit chart
Loading graph
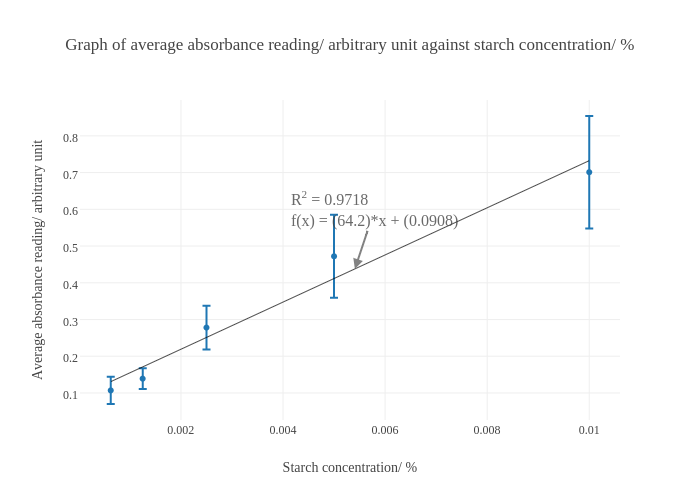
Dayweads's interactive graph and data of "Graph of average absorbance reading/ arbitrary unit against starch concentration/ %" is a scatter chart, showing Col2 vs Col2 - fit; with Starch concentration/ % in the x-axis and Average absorbance reading/ arbitrary unit in the y-axis.. The x-axis shows values from 3.457375734901118e-05 to 0.01059042624265099. The y-axis shows values from 0.02646777777777777 to 0.8975122222222222. This visualization has the following annotation: R2 = 0.9718f(x) = (64.2)*x + (0.0908)