Edit chart
Loading graph
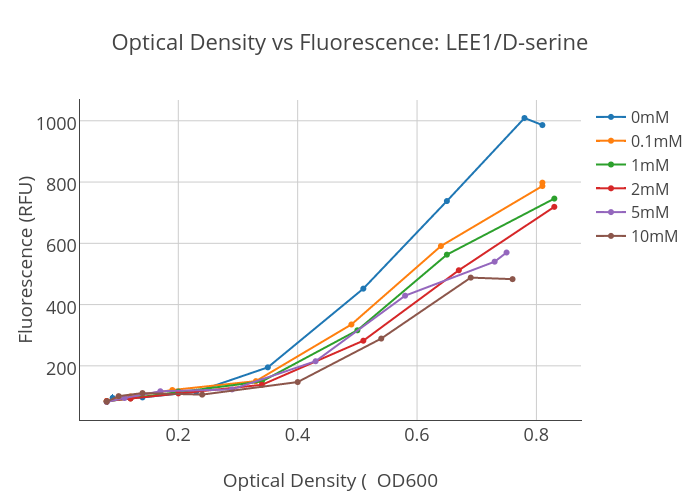
Davidk06's interactive graph and data of "Optical Density vs Fluorescence: LEE1/D-serine" is a scatter chart, showing 0mM, 0.1mM, 1mM, 2mM, 5mM, 10mM; with Optical Density ( OD600 in the x-axis and Fluorescence (RFU) in the y-axis.. The x-axis shows values from 0.035307871042695324 to 0.8746921289573046. The y-axis shows values from 23.147058823529406 to 1067.8529411764705.