Edit chart
Loading graph
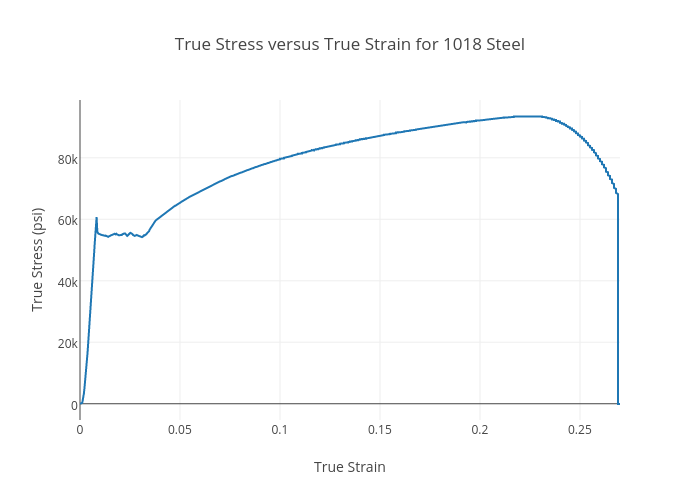
Darrenalilim's interactive graph and data of "True Stress versus True Strain for 1018 Steel" is a scatter chart, showing True Stress (psi); with True Strain in the x-axis and True Stress (psi) in the y-axis.. The x-axis shows values from 0 to 0.27. The y-axis shows values from -5290.566666666668 to 98804.76666666666.