Edit chart
Loading graph
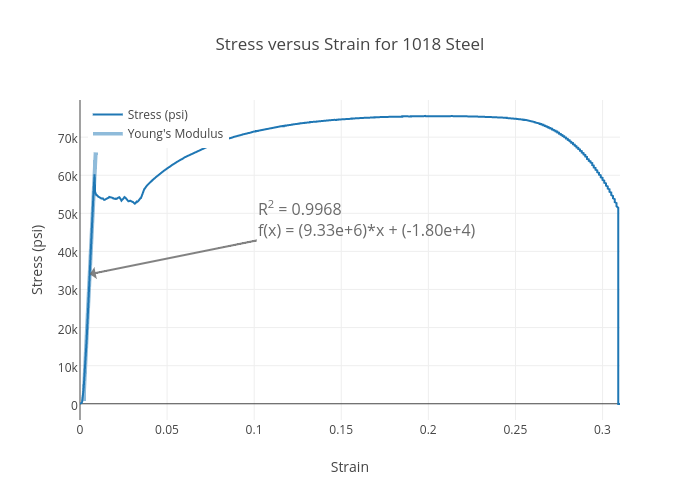
Darrenalilim's interactive graph and data of "Stress versus Strain for 1018 Steel" is a scatter chart, showing Stress (psi) vs Young's Modulus; with Strain in the x-axis and Stress (psi) in the y-axis.. The x-axis shows values from 0 to 0.31. The y-axis shows values from -4266.638213295556 to 79754.80152701556. This visualization has the following annotation: R2 = 0.9968f(x) = (9.33e+6)*x + (-1.80e+4)