Edit chart
Loading graph
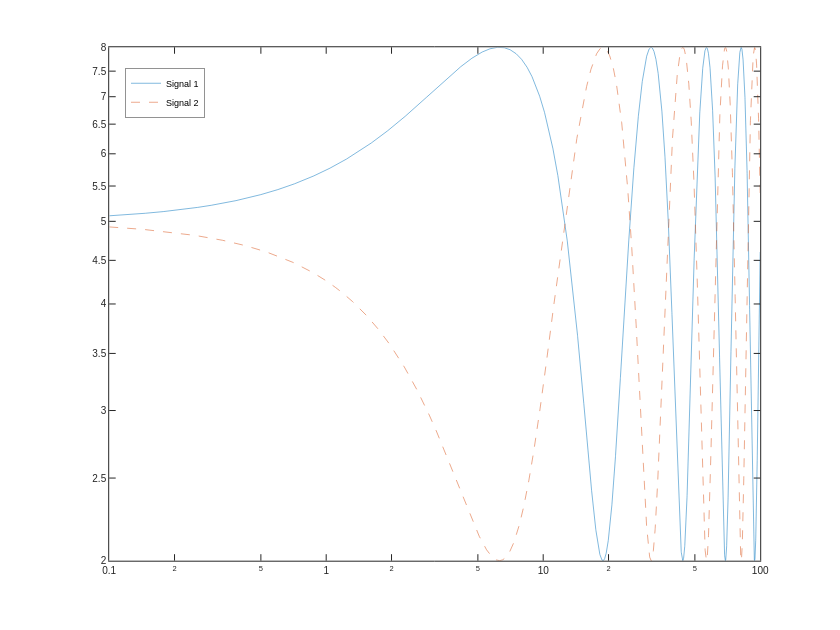
Danton267's interactive graph and data of "" is a line chart, showing Signal 1 vs Signal 2. The x-axis shows values from 0 to 0. The y-axis shows values from 0 to 0. This visualization has the following annotation: