Edit chart
Loading graph
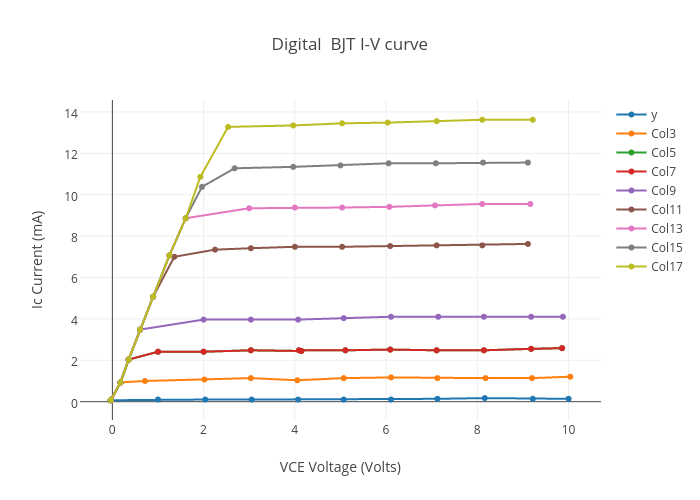
Danivanegas's interactive graph and data of "Digital BJT I-V curve" is a scatter chart, showing y, Col3, Col5, Col7, Col9, Col11, Col13, Col15, Col17; with VCE Voltage (Volts) in the x-axis and Ic Current (mA) in the y-axis.. The x-axis shows values from -0.7150742831908653 to 10.715074283190853. The y-axis shows values from -1.0696014697569296 to 14.759256642170747.