Edit chart
Loading graph
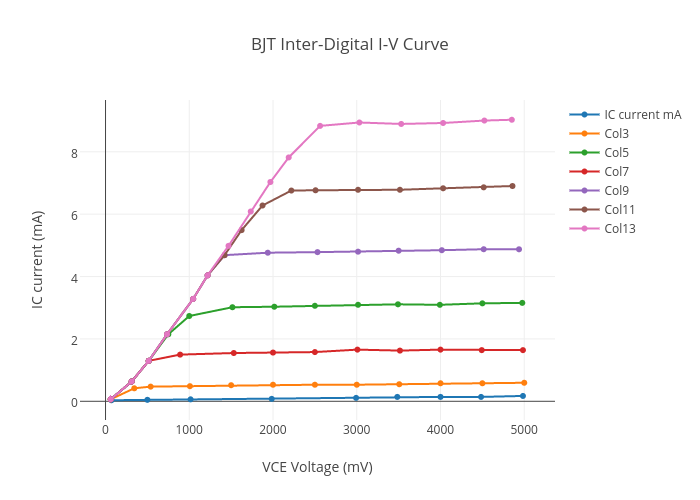
Danivanegas's interactive graph and data of "BJT Inter-Digital I-V Curve" is a scatter chart, showing IC current mA, Col3, Col5, Col7, Col9, Col11, Col13; with VCE Voltage (mV) in the x-axis and IC current (mA) in the y-axis.. The x-axis shows values from -307.29805099289 to 5369.798050992885. The y-axis shows values from -0.7221259445440613 to 9.78218453829408.