Edit chart
Loading graph
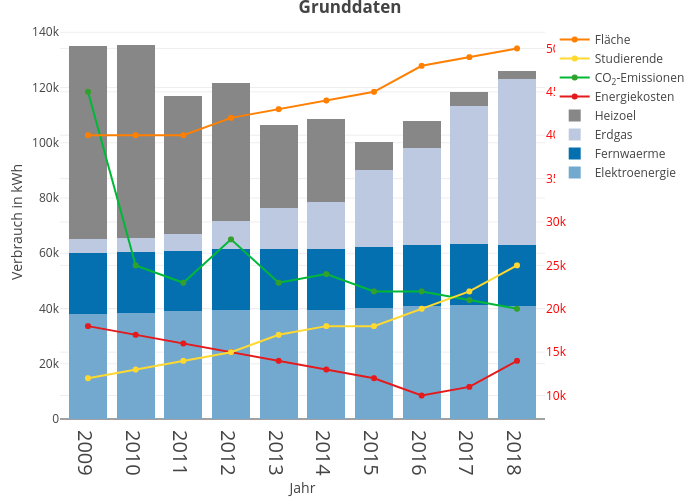
Daniel269's interactive graph and data of "Grunddaten" is a stacked bar chart, showing Elektroenergie, Fernwaerme, Erdgas, Heizoel, Energiekosten, CO2-Emissionen, Studierende, Fläche; with Jahr in the x-axis and Verbrauch in kWh in the y-axis.. The x-axis shows values from 0 to 0. The y-axis shows values from 0 to 0.