0.2
0.4
0.6
0.8
1
1.2
1.4
1.6
1.8
2
2.2
2.4
2.6
2.8
1
1.01
1.02
1.03
1.04
1.05
1.06
1.07
1.08
1.09
1.1
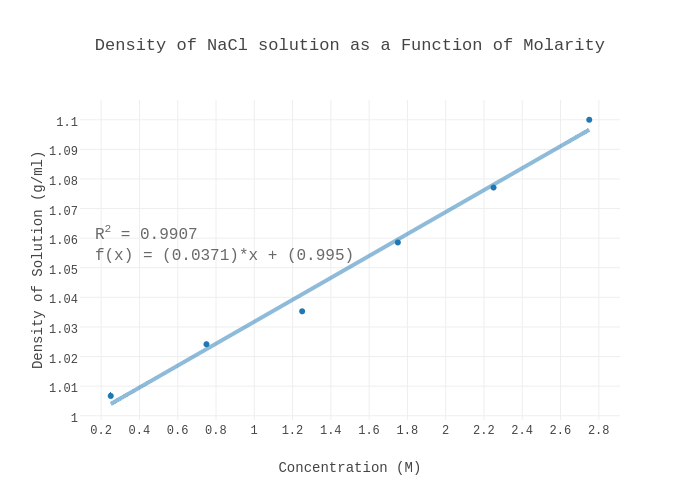
Density of NaCl solution as a Function of Molarity
Concentration (M)
Density of Solution (g/ml)
R
2
= 0.9907
f(x) = (0.0371)*x + (0.995)
plotly-logomark
Edit chart
Cvaltier's interactive graph and data of "Density of NaCl solution as a Function of Molarity" is a scatter chart, showing Col2 vs Col2 - fit; with Concentration (M) in the x-axis and Density of Solution (g/ml) in the y-axis.. The x-axis shows values from 0.09828902018709995 to 2.9017109798129. The y-axis shows values from 0.9985978287014832 to 1.106094688005164. This visualization has the following annotation: R2 = 0.9907f(x) = (0.0371)*x + (0.995)