Edit chart
Loading graph
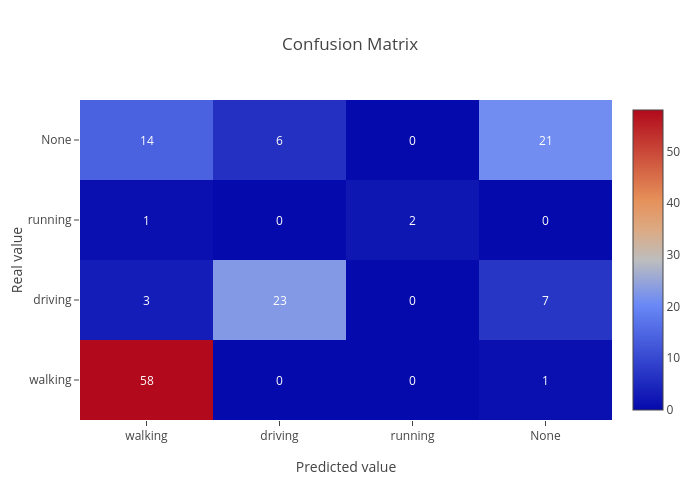
Cucari's interactive graph and data of "Confusion Matrix" is a heatmap; with Predicted value in the x-axis and Real value in the y-axis.. The x-axis shows values from 0 to 0. The y-axis shows values from 0 to 0. This visualization has the following annotations: 58; 0; 0; 1; 3; 23; 0; 7; 1; 0; 2; 0; 14; 6; 0; 21