Edit chart
Loading graph
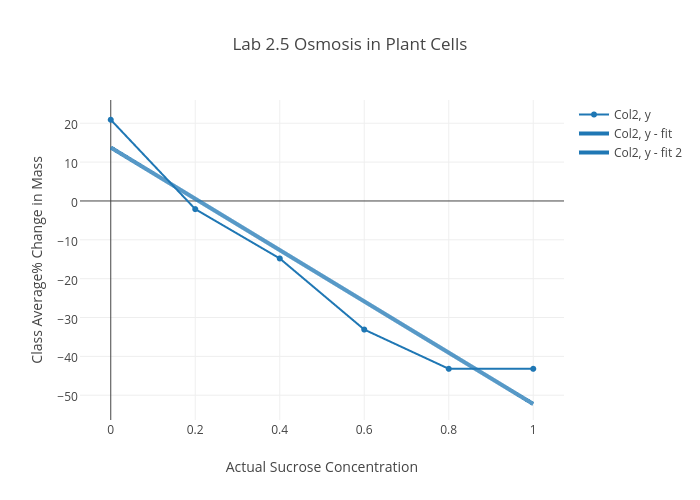
Crystal.deng's interactive graph and data of "Lab 2.5 Osmosis in Plant Cells" is a scatter chart, showing Col2, y, Col2, y - fit, Col2, y - fit 2; with Actual Sucrose Concentration in the x-axis and Class Average% Change in Mass in the y-axis.. The x-axis shows values from -0.061467200801201806 to 1.0614672008012018. The y-axis shows values from -56.374211502783304 to 25.967161410018576.