Edit chart
Loading graph
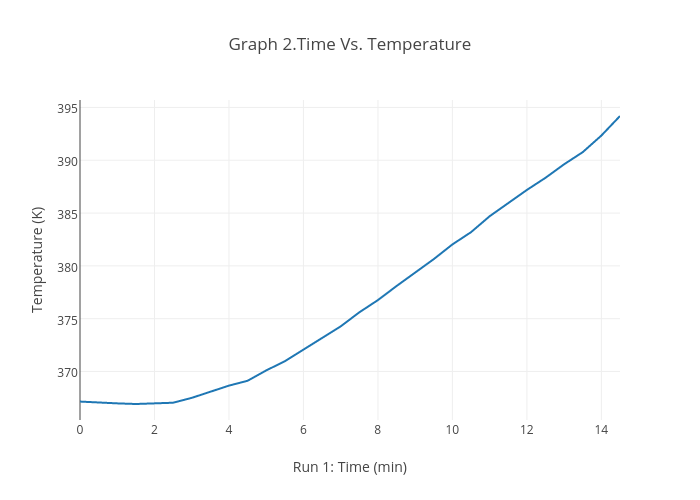
Cowas78's interactive graph and data of "Graph 2.Time Vs. Temperature" is a scatter chart, showing Col4; with Run 1: Time (min) in the x-axis and Temperature (K) in the y-axis.. The x-axis shows values from 0 to 14.5. The y-axis shows values from 365.40500000000003 to 395.705.