Edit chart
Loading graph
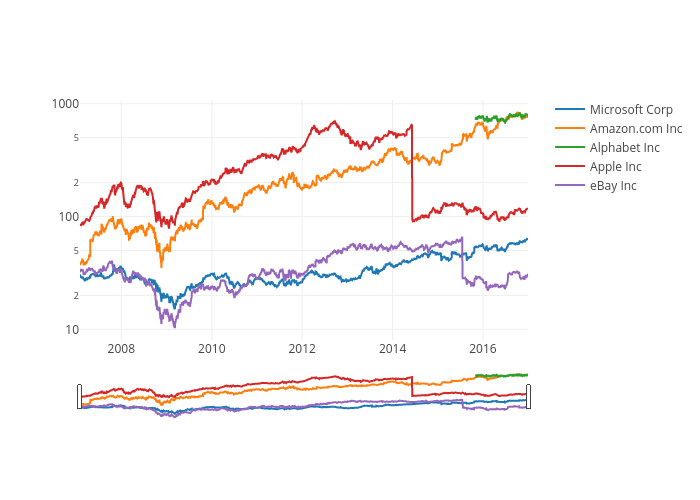
Codeastar's interactive graph and data of "Stocks Price Chart" is a line chart, showing Microsoft Corp, Amazon.com Inc, Alphabet Inc, Apple Inc, eBay Inc; with Date in the x-axis and Price (USD) in the y-axis.. The x-axis shows values from 2007-02-01 to 2016-12-30. The y-axis shows values from 0.9051839320625903 to 3.0329141627563465.