Edit chart
Loading graph
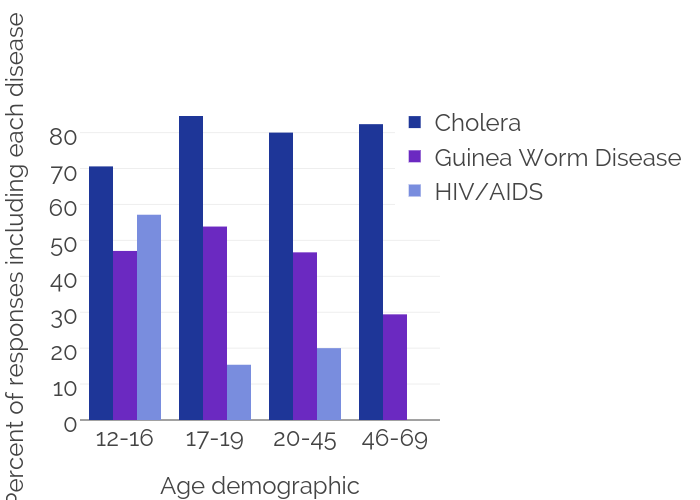
Claratoo's interactive graph and data of "Which diseases do you think are caused by water scarcity/pollution?" is a bar chart, showing Cholera, Guinea Worm Disease, HIV/AIDS; with Age demographic in the x-axis and Percent of responses including each disease in the y-axis.. The x-axis shows values from -0.5 to 3.5. The y-axis shows values from 0 to 89.07368421052632.